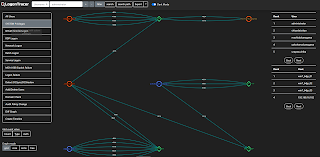
LogonTracer during forensic investigations
Recently I have been using LogonTracer for forensic investigations, where I collect Security.evtx from multiple affected endpoints and feed it to LogonTracer. This helps me to visualize the logon activities, identify lateral movement activities and understand adversary movement during intrusions.
Thanks again to Japan CERT for providing this great tool to investigators. https://github.com/JPCERTCC/LogonTracer
Setting up LogonTracer
Setting up LogonTracer is pretty staight forward.
We first install neo4j and the run logontracer.py script to start the interface. Multiple evtx file scan be uploaded to be fed to logontracer for visualization, from the console or using command line to upload evtx file to logontracer. Once uploaded and parsed, refresh the page to start looking at the security event logs graphs.
The provision of being able to upload additional event logs without deleting previously uploaded data along with the idea of scripting to push evtx files to logontracer for parsing and processing, makes it very useful during Incident Response triage phase and automating triage.
I used the docker method, which is pretty straightforward. First, install Docker Desktop for windows and pull the docker image using command line. Once pulled, run it with the following syntax:
docker run \
--detach \
--publish=7474:7474 --publish=7687:7687 --publish=8080:8080 \
-e LTHOSTNAME=[IP_Address] \
jpcertcc/docker-logontracer
Using the play button on the Docker Windows console will start up the container as well.
The following icon is used to start a shell from inside the docker container:
alternatively the following command can land us a shell inside the docker container as well. This is only required when debugging any error during container startups.
Uploading multiple evtx files from the logontracer console:
We need to also specify the timezone relative to the UTC timezone:
On the left panel you can click on different visualizations type and see the results and start analyzing the intrusion. The right panel describes the entities (users and machines) involved during the intrusion. Hovering your mouse over various links will tell more about the timestamps of events.
In summary it is a good tool in your arsenal when you are performing intrusion investigations.


Comments
Post a Comment