Live forensic collection and triage using CyLR, CDQR and Skadi
Today, I will show you how to use the awesome github projects from https://github.com/orlikoski/ in order to quickly gather forensic artifacts from a live endpoint for triage purpose (live response), process the artifacts and insert into elasticsearch in timesketch and kibana formats. Timesketch is a great tool for timeline analysis and Kibana can be used for visualization of gathered artifacts and perform analysis.
The three components from orlikoski github, which are used are as following:
1. CyLR windows binary (runs on the live endpoint to perform very fast collection, with minimum impact on the endpoint by not writing much to disk and storing the collected artifacts in memory and transferring all that data to an SFTP server). https://github.com/orlikoski/CyLR
2. CDQR.py. You need to download the portable SKADI ovf from https://github.com/orlikoski/Skadi. This is the VM which will also act as the SFTP server, where CyLR will send the collection to. Skadi also contains the cdqr.py python script, which will work on the collected artifacts, parse them in JSON and insert them into elasticsearch.
3. SKADI. As mentioned earlier this is an ovf file to be downloaded and mounted on the virtualization platform of your choice. This needs to be up and running and should be accessible by the endpoint on which CyLR will execute.
Important: You need to give SKADI a considerable amount of RAM and processing resources.
Let us start by compiling the CyLR project in MS Visual Studio and generating the binary CyLR.exe


Before we run CyLR.exe on host we should run the Skadi Portable VM, so that its SFTP server is ready to accept connections from the Cylr.exe client.
Login with skadi/skadi

Once logged on, you will see three main tabs in Firefox. One of them is for Kibana, other one for TimeSketch and the third one for Cerebro. Cerebro is an open source(MIT License) elasticsearch web admin tool built using Scala, Play Framework, AngularJS and Bootstrap.


Cerebro can be used to manage your elasticsearch cluster

This is how you run the Cylr.exe on the suspicious endpoint, which requires triage.

Once executed, you will see that the SKADI server on skadi home, has the zip file which contains the forensic collection from the endpoint. This will be named as the hostname of the suspicious endpoint, where CyLR.exe has been executed:

We will first run cdqr.py and indicate the “win” plugin as well as –es_kb to indicate that the results of the processing needs to be inserted into elasticsearch for kibana visualization and at the same time we specify the index name “case1”.

As a result of processing, we can log back in kibana and see
the various artifacts using Discover and create our own visualization (As per
one’s own imagination) for analysis purpose:

These are different dashboards available by default:

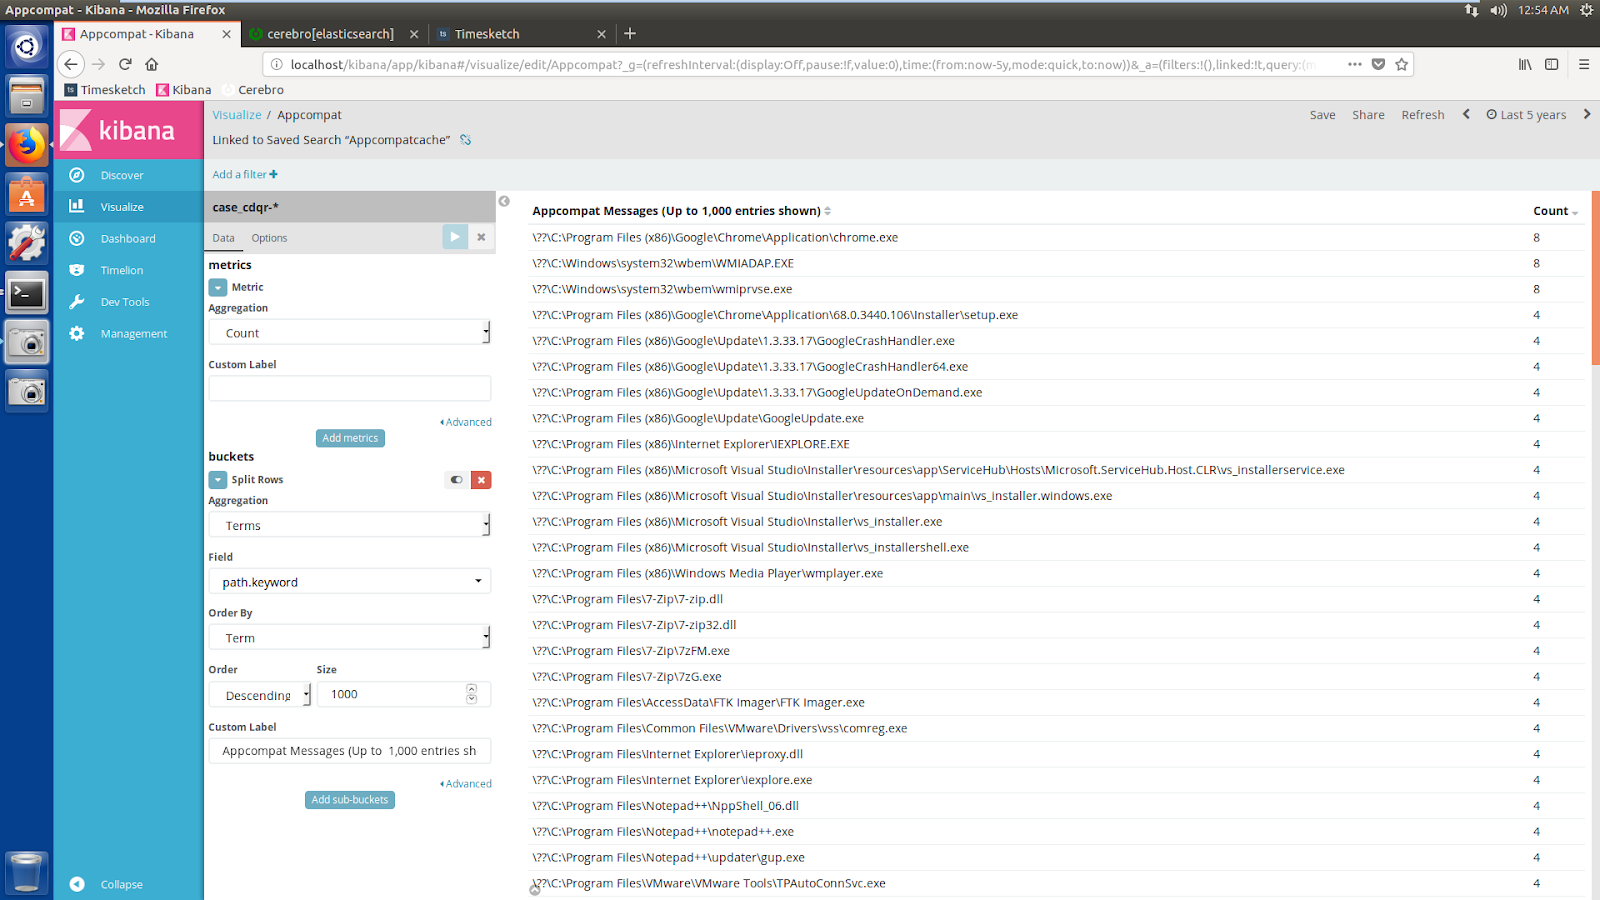
For example, we can perform LFO analysis of Appcompat cache
forensic artifact. If multiple hosts’ data is processes and inserted into
elasticsearch, this can act as a proactive threat-hunting platform, for e.g:
looking for malicious binary executions in the network.

Now let us run cdqry.py again on the zip file and this time we will use the –es_ts parameter to tell cdqy to insert data into elasticsearch for timesketch format and we can give the same index name in order to maintain consistency in visualization etc


A very helpful timeline visualization of all the forensic
artifacts collected along with their relevant timestamps:

You can filter the time line using the time range filter. For example you can put a filter a few minutes before the incident pivot timestamp and a few hours after that and see what the timeliner shows:

Now let us run a malware sample on a machine and analyze the
usability of these tools in terms of efficiency and effectiveness.
After execution of malware the user will see this messagebox
appearing:

The sample drops server.exe under appdata\roaming and
executes it, which among other things also look for executions of certain
programs like wireshark and taskmanager and kills them. It also creates a
firewall rule to allow any connection from outside and call the rule server.exe.


We can see the process tree, whereby we can see the dropped server.exe was spawned from winnti.exe and multiple netsh.exe commands are executed by server.exe:

Commandline shows that some firewall rules are created:


It also drops “Explower.exe” in various places including the
startup folder for maintaining persistence. It also renames the dropped file as
“<some random number>Windows Update.exe” and also places it in the
startup folder for persistence.

We can see the inbound rule creation in the Windows Firewall:

Kills wireshark and task manager
Not allowing wireshark or task manager to run
After killing the malicious server.exe I am able to run
wireshark and task manager
Now, assuming we are triaging the incident, we would run
Cylr on the endpoint and process the resultant zip file on Skadi server by
using cdqr.py and then will look for events around the pivot timestamp to try
to see what forensic artifacts we can find using Skadi:
Let us try the timesketch first:

We can also export and mark the rows of interest in the timeline:

The csv file can also be used for investigation


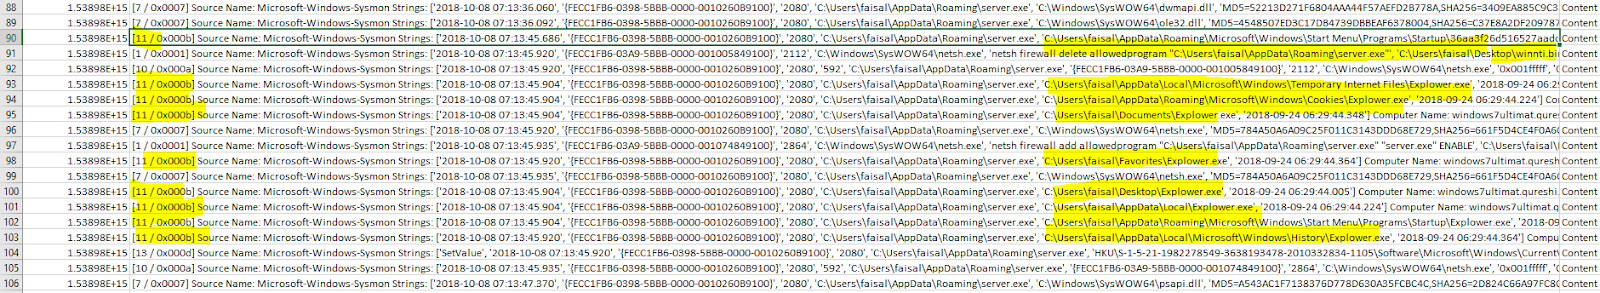
We can see multiple Event ID 11 (Sysmon - File creation activities), which is showing the droppped files by the malware:
Once we run cdqr.py to insert collection into elasticsearch and with --es_kb switch, it will take some time to complete. However, after completion we can use Kibana to discover and visualize:


We can use builtin visualization and dashboards to look at various artifacts:

The idea is to have an enterprise SKADI server running in a quarantine VLAN and once the suspicious endpoint(s) is also contained from production to the quarantine VLAN, CyLR to perform fast collection on endpoints and transferring the zipped files to the Skadi server and have a crontabbed script run to process these zip files and insert into elasticsearch. Once processing completes, the web interface can be used to perform analysis by the Incident Responders.


Comments
Post a Comment